Must-have survey
- How disappointed would you be if this product no longer existed tomorrow?
- What would you likely use as an alternative to (product name) if it were no longer available?I probably wouldn’t use an alternative, I would use:
- What is the primary benefit that you have received from (product name)?
- Have you recommended X to anyone?
- What type of person do you think would benefit most from X?
- How can we improve X to better meet your needs?
- Would it be okay if we followed up by email to request a clarification to one or more of your responses?
Tracking active user
Set up event tracking for the activities customers are engaging in all theway through the customer experience, as they go from a visitor to a new customer and from a new customer to a regular, loyal one.
- Track the complete path of what a customer does starting when they first visit your physical store or website all the way up through making their firstpurchase and then subsequent ones?
- If there are gaps there, those are theevents worth tracking first.
- analysts should be looking for features that are most used by the most avid users and any other distinctive aspects of their behavior in interacting with theproduct.
- By dividing your customer data up by many different customer attributes, such as demographic info (location, age, or gender) and additional attributes (their job title, industry, or mobile devicethey use), as well as by the ways in which they are using your product,(whether they are power users or only intermittently use it), and examining the choices they are making, including which products they are shopping for or the services they are availing themselves of, you will discover correlation between thore attributes and behavior and greater levels of purchasing, higher engagement and long term use
- Tracking key actions of users: identify key events within system (user clicks a button, watches a video, download a document, fills out a form, plays a song, add a friend, shares a file, etc. ⇒ key mission 🔑: look for behaviors that are differentiate those customers who find your product must-have and who don’t
💡 The importance of collecting and analyzing both qualitative and quantitative data about customer use of your product and their thoughts about its strength and weaknesses before invest extensive time and resources in pushing for growth
Define essential metrics:
he way to determine your essential metrics is to identify the actions that correlate most directly to users experiencing the core value of your product
Ie. Facebook: how many people users invite to join their friend circle, how frequently they visit the site, how many posts and comments they make and how much time they spend on the site
🗒️ Regular use has a different meaning that is specific to your product
Growth hack process:
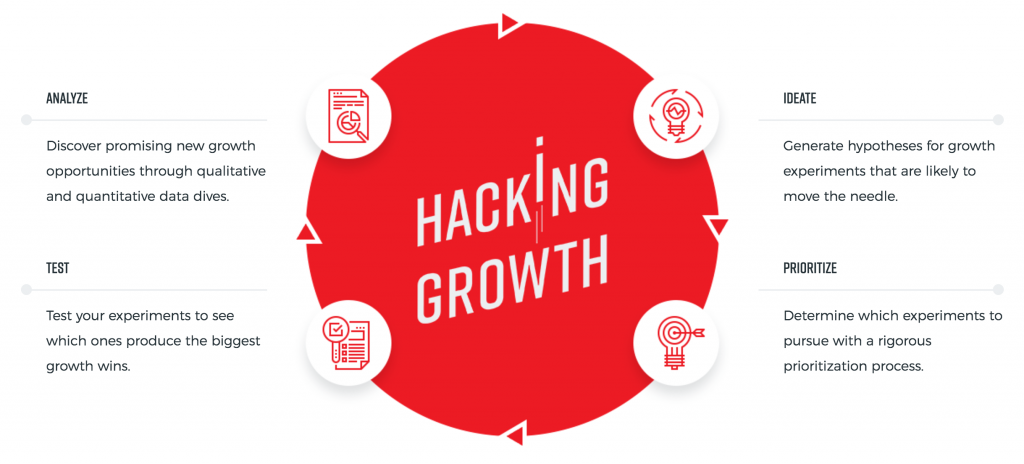
Stage 1: Analyse
Grocery app:
WHAT ARE MY BEST CUSTOMERS' BEHAVIORS?
• What features do they use?
• What screens in the app do they visit?
• How often do they open the app?
• What items do they buy?
• What is their average order size?
• What time of day do they shop and on which days?
WHAT ARE THE CHARACTERISTICS OF MY BEST CUSTOMERS?
• What sources were they acquired from? Was it an ad, a promotional email to the chain's customer base, or some other place?
• What devices do they use?
• What is their demographic background, including age, income, and more?
• Where do they live?
• How close are they to the store or other stores?
• What other apps do they use?
WHAT EVENTS CAUSE USERS TO ABANDON THE APP?
- What screens have the highest exit rates?
- Are there bugs that are preventing users from taking a particular action?
- How are the products priced relative to other services?
- What actions don't they take that users who purchase do?
- What is their path through the app, and how much time do they spend in the app before they abandon it?
Stage 2: Ideate
- Set up a project management system to coordinate the submission and management ideas + tracking and reporting the results
- Standardise the ideas format so that they can be quickly evaluated without the team needing to ask a lot of questions. Ie. Instead of vague suggestions like “Our sign up form is too hard, we should make it easier to sign up”, submission must articulate exactly what change to be tested, the reasoning behind why that change might improve results, and an explanation of how results should be measured. It should address the who, what, where, when, why, and how of the idea Who is being targeted? For example, all visitors, new users only, re. turning users, or users from a particular traffic source? What is going to be created, such as new marketing copy or a new feature? Where will the new copy or feature be implemented: Will it be on the app's home screen or elsewhere? When will it appear during the customer's use, such as on the landing page when a visitor first comes to the site? In addition, the description must include the why—the rationale behind the idea—and the how—a recommendation of the type of test to be done, such as an A/B test, or new feature to be built, or a new ad campaign to be launched.
- The metrics that should be tracked in order to evaluate the outcome of the test must be specified. Most experiments should measure more than one metric because sometimes, improvements in one metric come at the expense of others. Say that you're testing a new sign-up form to your landing page. You may find that the new design increases the number of new people signing up, because you made it easier to do so, but that those sign-ups are less engaged than previous new users because they didn't understand exactly what they were signing up for. Ultimately, that might be a serious impediment to growth. Identify metrics to be tracked by looking at the metrics "downstream” from the experiment that will be impacted.
🗒️ Submission example:
IDEA NAME:
We've found that giving each idea a brief name makes the discussion of them easier and more efficient. At Growth Hackers, to force brevity and clarity, we limit them to under 50 characters. For the purposes of this example, let's call this feature idea “Shopping List.»
IDEA DESCRIPTION:
Making it easier to view and reorder previously purchased items will increase the number of people who make repeat purchases and potentially the rate at which they purchase. Improving the convenience of reordering should prompt more reordering. The shopping list feature, which should be added to the app's navigation and available to every user, will make it easy for users to save and their favorite items. This feature should be tested with a group initial users before it is made widely available to all users.
HYPOTHESIS:
By making it easier for shoppers to view reorder previously purchased items, the number of people who make repeat purchases will increase by 20%
METRICS TO BE MEASURED:
For the shopping list, the metrics to be measured are the number of customers who use the shopping list feature, the number of items saved to each list, the number of repeat order purchases, the rate at which people reorder, and the average order size of each order. These metrics will help the growth team assess the experiment and its impact on the metrics that matter to them. The scope of measurement includes how many people use the new feature and also the feature's impact on their purchasing behavior, which gives the team insight into whether the experiment improved their key metric - the revenue per shopper- and whether the experiment hypothesis was correct or not
Stage 3: Prioritise
When submitting ideas, the submitter should rate each idea on. point scale, across each of the following three criteria: the idea potential impact, the submitter's level of confidence in how effective in will be, and how easy it will be to implement. Then those ratings are averaged to provide an aggregate score for each idea. The entire bank of ideas are then ranked by their scores, and the team begins experimentation with the highest-scored ideas in the area of focus chosen by the growth team. For example, a highly rated customer acquisition idea will be passed on in favor of a lower-scored idea around retaining users if the growth team is currently focused on improving customer retention.
Stage 4: Test
USE A 99 PERCENT STATISTICAL CONFIDENCE LEVEL:
Many, tools automatically set, or let you set for yourself, the confidence levels for tests. Common levels are 95 percent and 99 percent. While the difference of four percentage points may not seem like much, it is actually quite significant from a statistical point of view. A 95 percent confidence level means that a “winning” test can still be wrong 5 percent of the time. That means that 1 out of 20 tests that come back as winners could actually be losers. At 99 percent confidence, however, that number of false-positive tests drops to 1 out of 100: a much more valid result. Therefore, when in doubt, go with 99 percent confidence to greatly reduce the risk of mistakenly choosing a winning experiment on the basis of a false-positive result.graphis talents
CONTROL ALWAYS WINS:
When an experiment clearly fails, it's usually easy for a team to look at the data and come to quick agreement about that fact. Reaching consensus is dicier when the results of a test are weither clearly positive nor negative, especially if running it involved a good deal of time and effort. No one likes to have wasted good work, team members may want to let a test run much longer than is cost effective in the hopes that a larger sample size will change the currentend. While we understand why this is tempting, when results are inconclusive, the best course is to stick with the original, or control Version.
Prioritize channel based on 6 factors:
- cost
- Targeting
- Control
- Input time
- Output time
- Scale
.png)
.png)